Human Development (1997-2000)
—
translation: Louis Shurmer-Smith
published on July 21, 2005
(2005)
The Human Development Index (HDI) world average has progressed in 2000 compared to 1997: respectively 0.722 against 0.706.
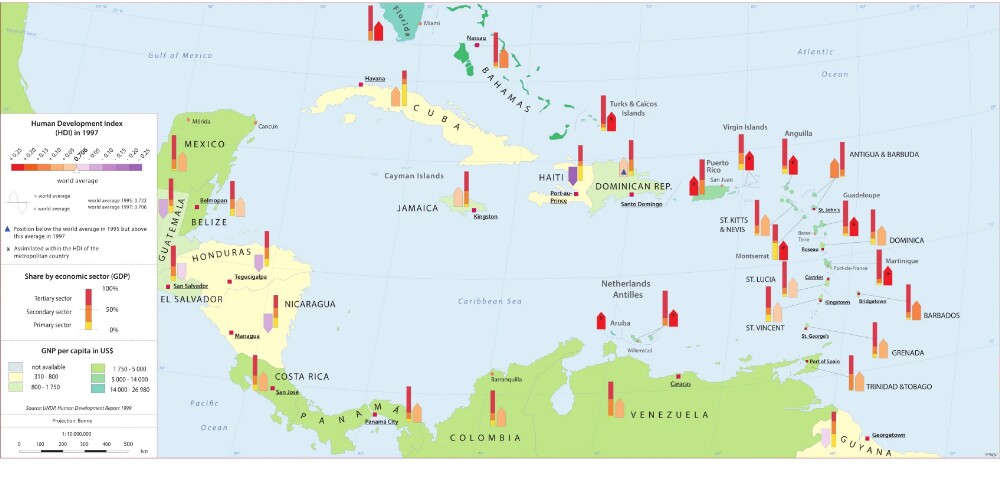
Table n°1 : Human development indicators 2000
(données sur 173 pays)
| Rank | Country | IDH 2000 | Life expectancy at birth (years) |
Adult literacy rate
(% age 15 and above) |
GDP per capita (PPP 1 - US$) |
| 6 |
United States
|
0.939 | 77.0 | 99.0 | 34 142 |
| 31 | Barbados | 0.871 | 76.8 | 98.0 | 15 494 |
| 41 | Bahamas | 0.826 | 69.2 | 95.4 | 17 012 |
| 43 | Costa Rica | 0.820 | 76.4 | 95.6 | 8 650 |
| 44 | Saint Kitts andNevis | 0.814 | 70.0 | 97.8 | 12 510 |
| 50 | Trinidad and Tobago | 0.805 | 74.3 | 93.8 | 8 964 |
| 52 | Antigua and Barbuda | 0.800 | 73.9 | 86.6 | 10 541 |
| 54 | Mexico | 0.796 | 72.6 | 91.4 | 9 023 |
| 55 | Cuba | 0.795 | 76.0 | 96.7 | nd |
| 57 | Panamá | 0.787 | 74.0 | 91.9 | 6 000 |
| 58 | Belize | 0.784 | 74.0 | 93.2 | 5 606 |
| 61 | Dominica | 0.779 | 72.9 | 96.4 | 5 880 |
| 66 | Saint Lucia | 0.772 | 73.4 | 90.2 | 5 703 |
| 68 | Colombia | 0.772 | 71.2 | 91.7 | 6 248 |
| 69 | Venezuela | 0.770 | 72.9 | 92.6 | 5 794 |
| 74 | Suriname | 0.756 | 70.6 | 94.0 | 3 799 |
| 83 | Grenada | 0.747 | 65.3 | 94.4 | 7 580 |
| 86 | Jamaica | 0.742 | 75.3 | 86.9 | 3 639 |
| 91 | St. Vincent and the Grenadines | 0.733 | 69.6 | 88.9 | 5 555 |
| 94 |
Dominican Republic
|
0.727 | 67.1 | 83.6 | 6 033 |
| 103 | Guyana | 0.708 | 63.0 | 98.5 | 3 963 |
| 104 | El Salvador | 0.706 | 69.7 | 78.7 | 4 497 |
| 116 | Honduras | 0.638 | 65.7 | 74.6 | 2 453 |
| 118 | Nicaragua | 0.635 | 68.4 | 66.5 | 2 366 |
| 120 | Guatemala | 0.631 | 64.8 | 68.6 | 3 821 |
| 146 | Haiti | 0.471 | 52.6 | 49.8 | 1 467 |
| Latin America and the Caribbean | 0.767 | 70.0 | 88.3 | 7 234 | |
| World | 0.722 | 66.9 | - | 7 446 | |
Source: UNDP, Human Development Report 2002.
-
PPP: purchasing power parity. The base year for the PPP data is 1996; data for the reference year 2000 were extrapolated using relative price movements over time between each country and the United States, the base country.
Note []
To cite this document:
Bégot, M. & Ducrot, D. (2005). Human Development (1997-2000). Atlas Caraïbe.